
When you're looking to boost retention, your churned customers should always be your first port of call.
Nothing beats a conversation with a customer who can clearly communicate why they left. Yet, even these conversations won't always paint a complete picture of your churn.
People are fallible. Sometimes they'll give you the hard truth, but often they'll hold back. Or they'll cite a surface-level feature issue when your pricing or positioning strategy was to blame. Or they just won't talk to you at all.
Whatever the case, you always have one source of information you can trust: your data. Your analytics are your best friend when it comes to honing in on the real reasons your customers are leaving. Let's look at three ways you can use your metrics to get a deeper understanding of your churn (and how to reduce it).

Table of Contents:
1. Getting to the Root Causes
2. Paths of Least Resistance
3. Testing, Testing
4. Putting Your Analytics to Work
1. Getting to the Root Causes
2. Paths of Least Resistance
3. Testing, Testing
4. Putting Your Analytics to Work
Getting to the Root Causes
Each of your new customers logs into your product for the first time filled with anticipation. After researching their options and working their way through your full sales cycle, they're excited to finally have a solution to their problem. But for those customers that eventually churn, there's some point when that excitement turns to frustration. It's the moment when they realize the value they expected just isn't being delivered.
That realization could happen during onboarding, but it's more likely to happen days, weeks, or months down the road.
This gets to the heart of the reason why self-reporting can be deceptive. Your churned customers generally can't trace their path back all the way to the first time they used your product. Even if they could, the rose-colored glasses they had on during customer onboarding would obscure some of the reasons for their frustration. Instead of pinpointing the exact reason they churned, they'll give you a proximate cause, like a feature that wasn't working.
If you're going to reduce your churn, it's essential that you dig deeper. The proximate cause isn't really why they churned; the root cause is.
This is where your data really starts to shine. Using usage data, you can trace your customer's path through your product, looking for the behaviors that may have led them to leave. You might trace their path back to onboarding and find that they didn't complete a key section of it. In this case, the proximate and root causes of churn are clear:
-
-
-
-
Customer feedback (proximate): Feature X wasn't working.
-
Data-driven insight (root): Customers didn't learn how to use feature X in onboarding.
-
-
-
With your usage analytics, you can check to see if this behavior extends to other customers.
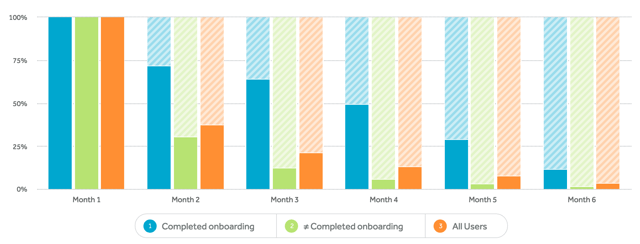
(Source: adapted from Amplitude demo)
In the graph above, usage data reveals a clear trend. Customers that fail to complete onboarding churn 2-4X more than customers that successfully finish the process. You should then look at the usage patterns of your churned customers to try to identify a cohort of customers at-risk of churning.
When you identify a root cause of churn, you need to take action. If the issue is onboarding, run A/B tests with different strategies to encourage users to complete it. Make sure you include customers who are at risk of churning in all of your tests to check your hypothesis about the root cause.
Yet, the root causes of churn that you find only tell half the story. It's essential that you understand what your most successful customers are doing differently.
Paths of Least Resistance
Your analytics can tell you more than what's going wrong. They also hold the key to understanding what's working for your customers. If you know some customers are having significant success with your product—high usage, high growth—then it's worth looking how they're using your app. There are a few different tools you can use for this:
-
-
-
Use analytics tools such as Amplitude, Mixpanel, or Interana to look at customer actions while using your product.
-
Use session replay tools such as FullStory to see how people are actually using your product.
-
-
In addition to understanding the work flows of your best users, you can identify desire paths your customers are taking in your product - paths you never intended users to take.
2ad1.png?width=640&name=desire-path-usability%20(1).png)
(Source: 99% Invisible)
There are two types of paths you want to look for:
-
-
-
Desirable paths that show successful customer behaviors you didn't anticipate.
-
Undesirable paths that show churned customer behaviors that weren't intended.
-
-
Your goal is to steer as many of your customers as possible towards those desirable paths and away from the undesirable ones. You can use these paths alongside those behaviors you anticipated to create usage funnels for your users. Consider using these paths as a blueprint for onboarding or adding premade work flows within your app that ensure your customers will take advantage of certain features.
Whatever action you decide to take, it's not enough to make a change and hope for the best. If you're going to successfully use data, you can't only find problems - you also have to validate your solutions.
Testing, Testing
Successfully fighting churn requires a lot of experimentation. Returning to our onboarding example, imagine that your analytics show that successful customers tend to watch more instructional videos during onboarding. At this point, you suspect there's a correlation but you haven't established causation. It's time for an experiment to test the impact of additional emphasis on video during onboarding.
This kind of experimentation is a key part of your retention process. After setting clear goals and asking the right questions with your retention analysis, this is when you take action.
Hypothesize
Developing a hypothesis for what you expect to occur during your experiments forces you to identify specific outcomes that mark success. In this case, a strong hypothesis would look like this:
“We believe adding an explanatory video to each tool tip during onboarding will increase engagement and reduce churn.”
While an experiment like this might be fairly low impact, the trend that motivated it was significant enough to show up in your data. Even an incremental improvement matters - remember, churn is a game of inches.
Test and Analyze
Implement the change and monitor the results with the same tools you used to discover the problem in the first place: your analytics. You can do this in two ways:
-
-
In the short term: Look at session replays to check if new users are watching videos more regularly. This won't give you the results you need to confirm success, but will allow you to understand if new users are starting to follow desireable paths you identified.
-
In the long term: Check event analytics to see if there's a corresponding drop in churn among users who participated in your redesigned onboarding.
-
While all experimentation is better than none, it's best practice to run A/B tests to measure the impact of your change. If you identify a crucial step in onboarding that your customers are missing, however, it may make sense to deploy the change to everyone.
Refine, Reject, Repeat
As with all testing: iterate, iterate, iterate. Run tests for each root cause of churn that you identify. When you see success, see if there's an opportunity to double down. If videos are working exceptionally well for onboarding, they might be able to be used in support. If you're taking full advantage of your analytics, you can find some initial data, create a hypothesis, and then start testing. This is how you can constantly carve away at your churn.
Putting Your Analytics to Work
Your analytics can tell you why your customers are leaving even if your customers can't. You can use your data to find and fix the problems driving your customers to churn while identifying desire paths that open up new possibilities within your product.
Actively using your data is the only way to turn the loss of a user into a meaningful gain for your business. Treat your analytics as a new way for your customers to share their feedback. All you have to do is start listening.

By Patrick Campbell
Founder & CEO of ProfitWell, the software for helping subscription companies with their monetization and retention strategies, as well as providing free turnkey subscription financial metrics for over 20,000 companies. Prior to ProfitWell Patrick led Strategic Initiatives for Boston-based Gemvara and was an Economist at Google and the US Intelligence community.