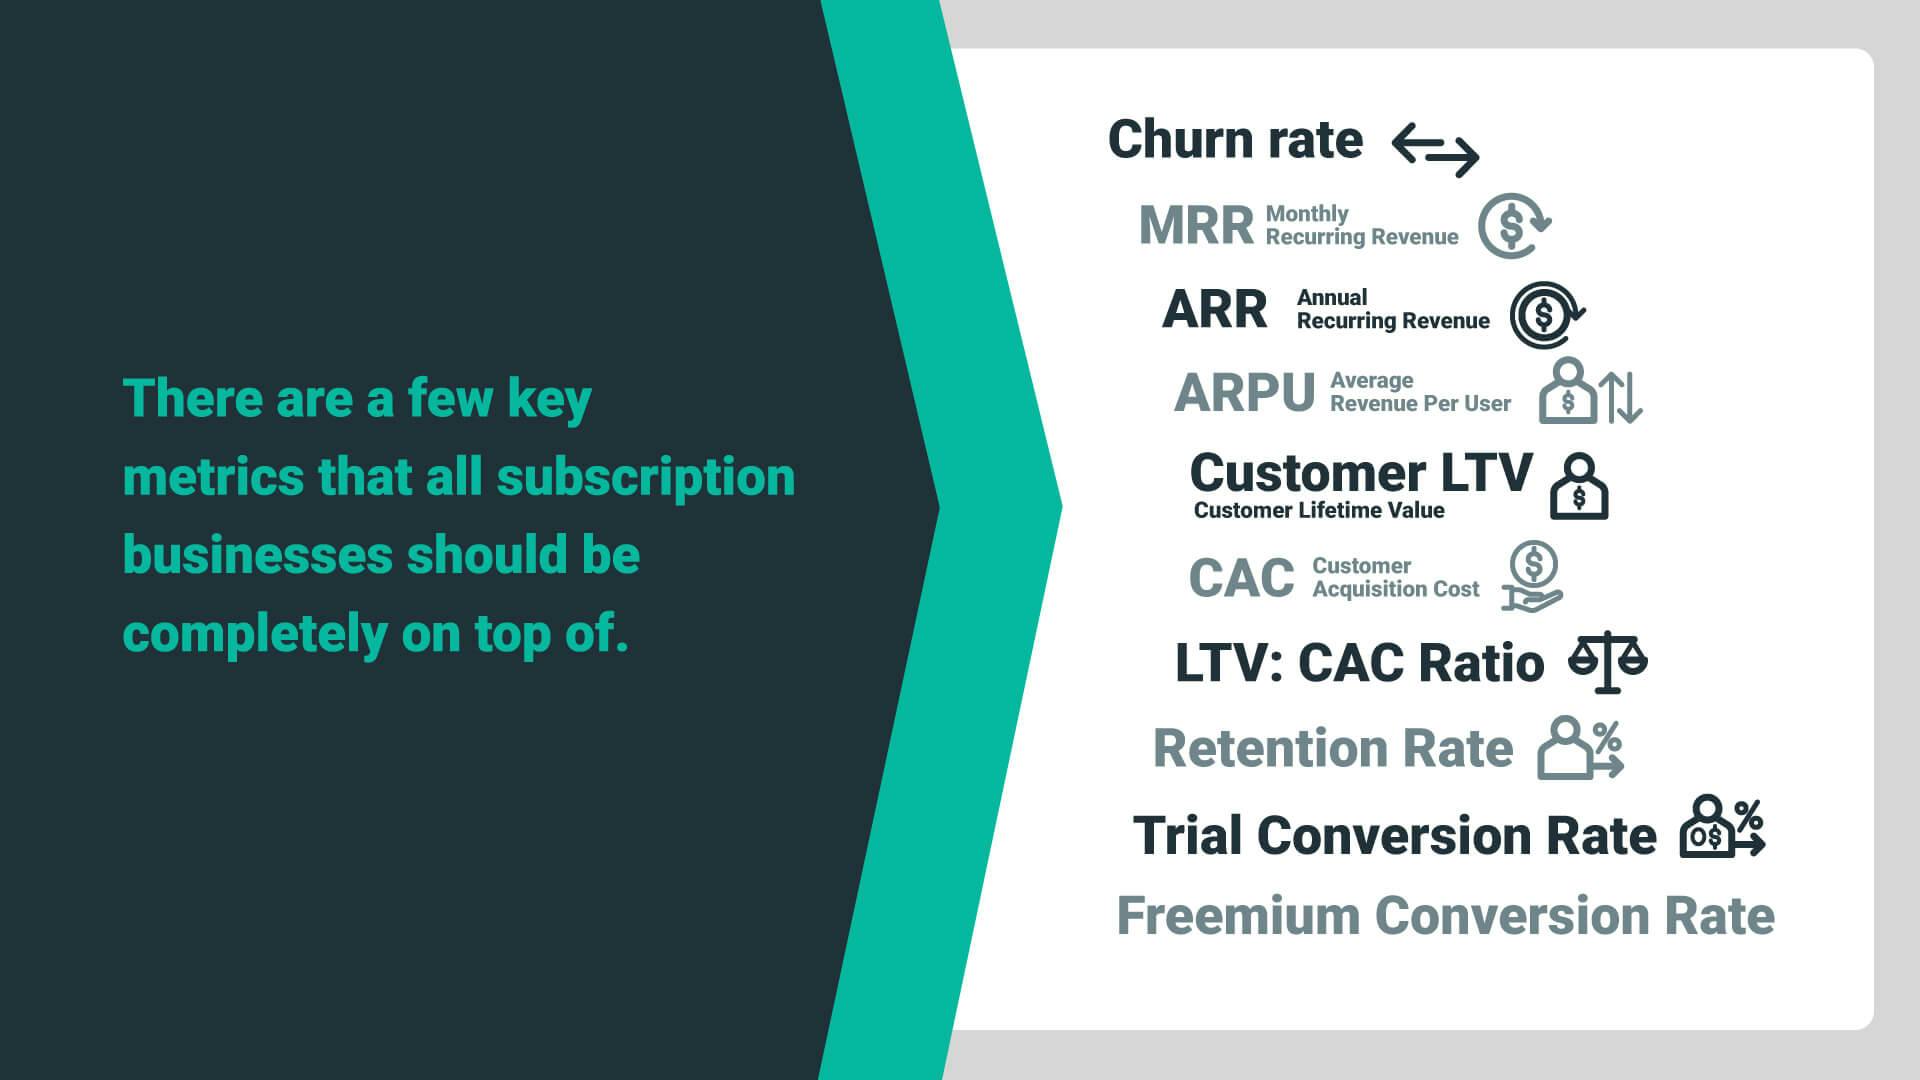
There are a few key metrics that all subscription businesses should be completely on top of. Think of these metrics less as numbers on a screen and more as indicators of business health. Without these, you won’t know how you’re faring.

1. Churn rate
Churn is the make or break of your subscription business. Churn is defined as the moment when a subscription ends and renewal does not happen, or when a customer cancels. The less time you have to track this, the more time you’ll be scrambling to get new customers and waste valuable company resources on acquisition. Stay on top of retention by tracking your customer churn rate.
Customer churn rate is an extremely simple concept—it’s the percentage of your customers who leave your service over a given period of time, divided by the total remaining customers. The number of churned customers reflects how many people have left your service over the period out of the total number of customers you had during the period.

Calculating your customer churn rate requires counting customers. The total number of customers for a given time period isn’t easily defined because the number is subject to change due to new sign-ons and cancellations
However, for any given month, there are three types of customers:
- Those who signed up the prior month. These customers will come up for renewal in the current month.
- New customers during the month.
- Newly churned customers during the month.
Churn has an impact on other SaaS metrics—MRR, customer LTV, CAC, net negative MRR churn (I’ll dive into each, momentarily). Churn is a direct reflection of the value of the product and the features you’re offering to customers. If your churn rate is high, then you need to re-evaluate your product offerings.
2. MRR
Monthly recurring revenue is fantastic for forecasting what you’ll be bringing in this year. It also serves as a great indicator of revenue growth or decline. Was your MRR down from last month? Looks like you may be losing customers. MRR is not part of GAAP (Generally Accepted Accounting Principles), IFRS (International Financial Reporting Standards) or reported to a government entity. But not calculating MRR correctly means you are lying to investors or setting yourself up for failure by planning momentum incorrectly.
MRR measures the total amount of predictable revenue that a company expects on a monthly basis. It’s an important figure for tracking monthly revenue figures and understanding the month-to-month differences in your subscription service. MRR is crucial for financial forecasting/planning and measuring growth/momentum.
3. ARR
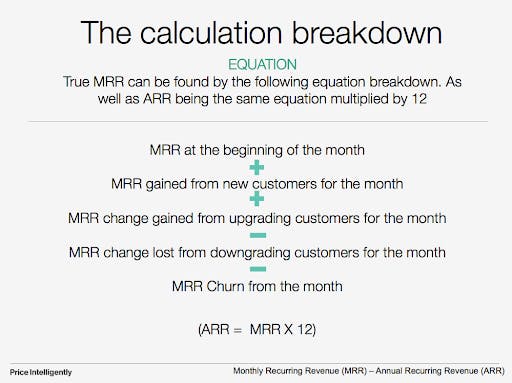
Annual recurring revenue is just the annualized equivalent of MRR (take your MRR and multiply by 12). MRR provides the monthly picture and ARR is the yearly picture of how your business is performing. Tracking both MRR and ARR allows you to plan for the short term and the long term.
Here’s how to calculate:
MRR at the beginning of the month + MRR gained from new customers for the month + MRR change gained from upgrading customers for the month - MRR change lost from downgrading customers for the month minus MRR churn from the month x 12 = ARR.

It’s important to note—not everything is included in your ARR and MRR calculations.
Do include:
- All recurring elements (monthly fees, charges per user, per visit, etc.)
- Account upgrades
- Account downgrades
- Lost MRR from churned customers
Do include:
- Set-up fees
- Credit adjustments
- Non-recurring add-ons
- One-time charges
4. ARPU
Average revenue per user (ARPU)—the “vanity metric” that actually matters. ARPU is the average amount of monthly revenue you receive per user. It’s calculated by dividing the total revenue by the number of customers you have. ARPU shows how much each user is spending on average, and if this number is lower than your customer acquisition cost (CAC), you have a BIG problem.
When calculated and broken down correctly, ARPU helps identify trends in a group of customers booked within the month against different cohorts and segments.
Like MRR and ARR, tracking ARPU helps you plan for the short term and the long term. It can be the base for accelerating MRR growth through higher paying customers. Higher ARPU is also a source of fuel for your customer LTV.
Here’s what calculating ARPU will reveal about your SaaS business:
- Growth of your MRR and LTV
- The financial visibility of your business
- Price alignment and product validation
- The efficiency of your sales and marketing team
5. Customer LTV
Subscription businesses rely heavily on keeping customers around for a very long period of time. The longer your customer stays on, the more likely a customer will spend more over their customer lifetime. That’s why tracking customer lifetime value, or LTV, is so important. Customer LTV represents the amount of money a customer is expected to spend on your products during their lifetime as a customer. Different LTV models can inform decisions like how much you can pay to acquire a user, the effects of losing users, and how changes to a product affect the sum-total revenue you can bring in from users.
It’s an easy metric to see the overall health of a product in regards to revenue and customer retention. A growing LTV indicates a customer is happy and the company is doing well. A declining LTV means a company is getting less money out of each customer and needs to make some changes, fast.
6. CAC
Customer acquisition cost shows how much you’re spending on acquiring a customer. CAC is the total cost of sales and marketing efforts that are needed to acquire a customer. It’s one of the defining factors in whether your SaaS company has a viable business model that can yield profits by keeping acquisition costs low. As you scale, CAC should be as low as possible. If your CAC is high, you may want to focus on retention.
How to calculate: CAC = (total cost of sales and marketing) / (# of customers acquired)
7. LTV:CAC ratio
LTV and CAC are dynamic metrics to understand separately, but they are even more telling when put together. Your LTV:CAC ratio reveals how much customers are spending and whether or not it's worth it, depending on how high your CAC is. Correctly calculating CAC allows you to quantify and optimize your marketing funnel.
Typically, the benchmark LTV:CAC ratio is 3:1. If your CAC is higher than your LTV, then you need to make some adjustments. It means you spent too much money on acquiring customers who are not spending enough money with your company to balance out the acquisition expense. This ratio can be optimized through your sales and marketing output.
8. Retention rate
Obviously, you should shoot for a retention rate of 100%, but often that is close to impossible. Keeping your retention rate as high as humanly possible should be the goal of every subscription business out there.
Your retention rate is the percentage of customers you retain in a given time period. A high retention rate logically shows that a business has a low churn rate. Your retention rate is by no means a static metric, which is why you need to pay close attention to it and constantly strive to optimize it.
Your retention rate is calculated by dividing your active users who continue their subscriptions by the total number of active users in a given time period.
9. Trial conversion rate
Offering trials should serve as a tactic to convert customers—not a free resource that’s there for no reason. By calculating your trial conversion rate, you’re determining how many customers convert to paying users once the free trial version of your product ends.
If you find that the trial conversion rate is low, then you need to determine why people are making the jump to become devoted, paying customers.
Here are some takeaways:
- Talk to your customers: Ask customers who were recently onboarded about the experience. What changes can be made? What did they like? What didn’t they like?
- Find your minimum path to awesome: Determine the one or two pieces that gets your customer hyped about your product. Once you find a common thread, use it to your advantage.
- Use email and in-app boarding: Take advantage of technological resources to ensure ease of onboarding for your customers.
- Pre-qualify trial customers: Create a unique experience by asking some pre-qualifying onboarding questions to personalize the minimum path to awesome.
- Keep it simple: Onboarding should be easy and painless.
10. Freemium conversion rate
Freemium is a combination of free and premium; basic services are offered for free and customers are able to upgrade to premium if they want more services. Understanding your freemium conversion rate is similar to understanding your free trial conversion rate. What’s the percentage of customers who convert after trying the freemium version of your product? If the conversion rate is not high, you may be giving too much away in your freemium model. Or, you need to re-evaluate your product offerings altogether.
Freemium is an acquisition model, not a revenue model. It’s a measurement strategy to unlock lower CAC and the top of your funnel. If you don’t have freemium but offer free trials (and your free trial conversion rates are low), you should consider adopting the freemium strategy.
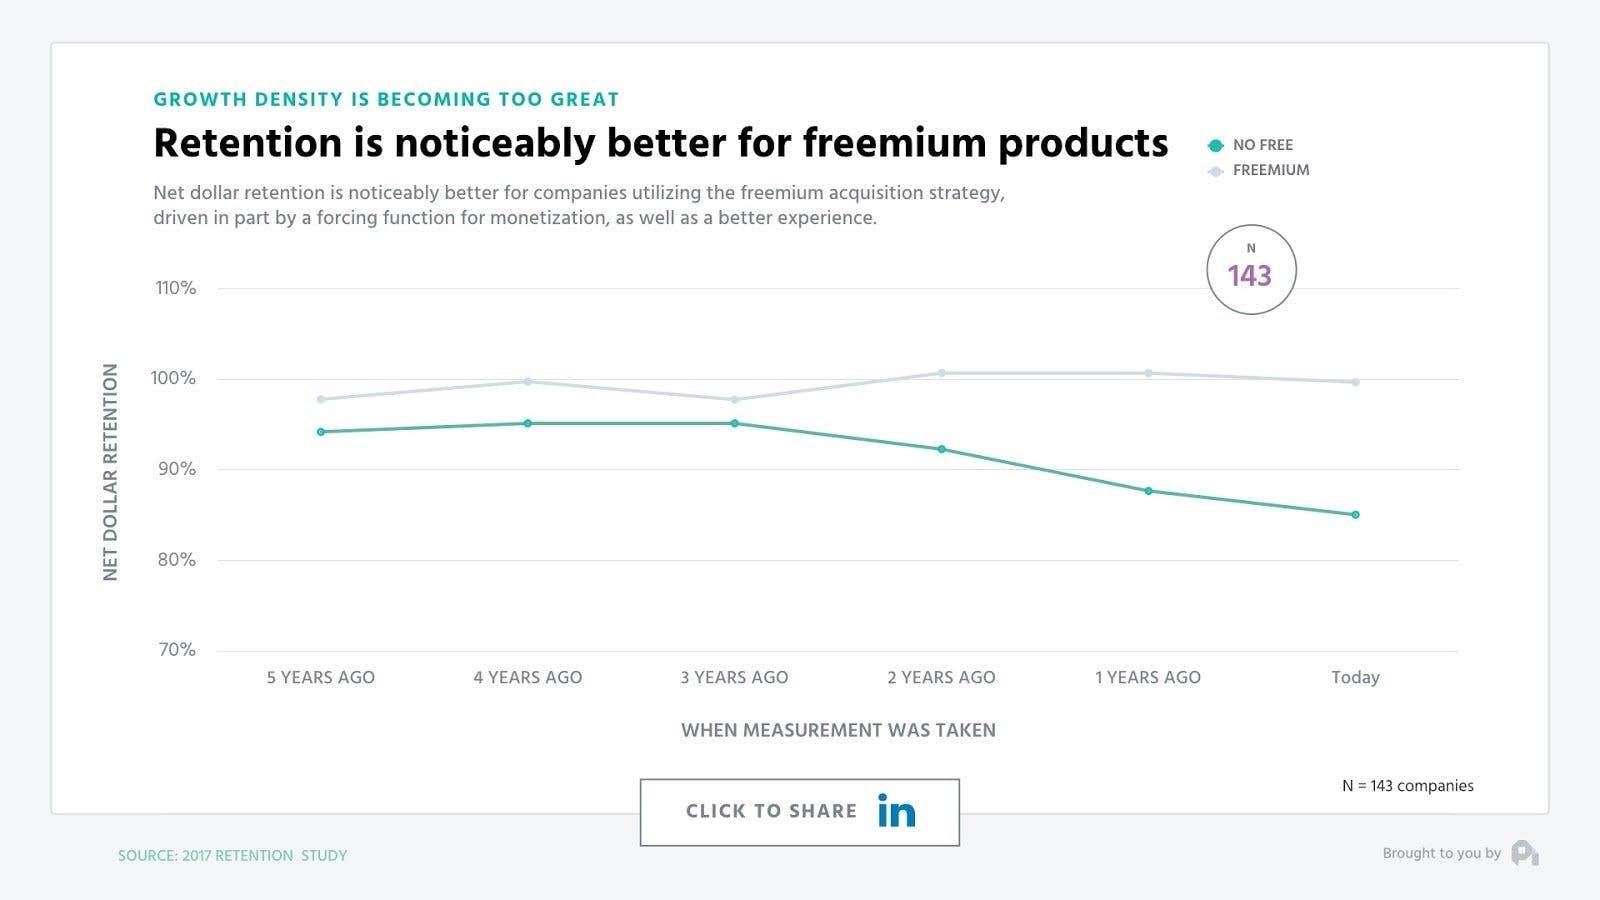
Here at ProfitWell, we’ve done extensive research on the power of freemium and found that free has actually become more effective than non-free alternatives—the data proves. The graph below shows how retention is 15% better on an absolute basis for those companies utilizing freemium.

11. Track all these metrics (and more) for free
Operating a SaaS business is difficult in itself, let alone having to juggle calculating a dozen metrics at a time. That’s why we developed ProfitWell Metrics—our subscription analytics software. It’s completely free because we believe in not making money until you do. In addition to the metrics mentioned in-depth above, Metrics analyzes some additional ones as well.
Customer segmentation
Customer segmentation divides customers into groups based on common characteristics, allowing companies to market to each group effectively. When you properly segment, you know which customers appreciate which features, allowing you to sell more effectively. With Metrics, you can segment your data by gender, location, usage, and up to 107 other pre-built segments, for free.
Acquisition insights
Proper growth requires understanding how prospects turned into customers and connecting that data through the entire customer lifecycle. Metrics allows you to track your trials and attribution at ease.
Retention efforts
Once you acquire customers, how long is it before they churn? Tracking retention is important because it helps mitigate churn. Sustain growth by keeping your customers. ProfitWell helps you track revenue retention, MRR churn, and delinquent churn. Cohort reports help you visualize how revenue and customers stay over time.
Engagement figures
Studying customer engagement figures allows you to know who’s going to convert or who’s going to churn before the customers even know themselves. With engagement figures, it’s all about understanding your customers' usage patterns. Knowing the relationship you have with every single customer, including shifts in usage across gender, location, and any other segment allows you to predict how long a customer plans to stay with your company.
Know your metrics like the back of your hand
Fully understanding your metrics means not only doing the calculations, but also seeing the number, understanding the number, and then taking action upon the number, depending on whether it’s good or bad. The metrics we went over in this article—churn rate, MRR, ARR, ARPU, LTV, CAC, LTV:CAC ratio, retention rate, trial conversion rate, and freemium conversion rate—indicate the health of your business for the short and the long term. Don't guess your metrics, know for sure. Get ProfitWell Metrics for free.

