From expansion CAC Ratio and Net Dollar Retention to CAC Payback and the Rule of 40, these are the five most impactful revenue growth metrics in 2023.
“Efficient growth never goes out of style.” Scaling SaaS might be tougher in 2023, but focusing on the right metrics and operational benchmarks will bring revenue growth back into the picture. That’s according to Ray Rike, Founder and CEO at RevOps Squared, Ben Murray, the SaaS CFO, and Andrew Davies, Paddle CMO on a webinar recently.
Their discussion covered performance metrics that investors will use to evaluate your company and operational metrics that you can use to determine efficiency. Here’s a breakdown of their chat around the five SaaS revenue growth metrics that matter most in 2023.
#1 Expansion CAC Ratio
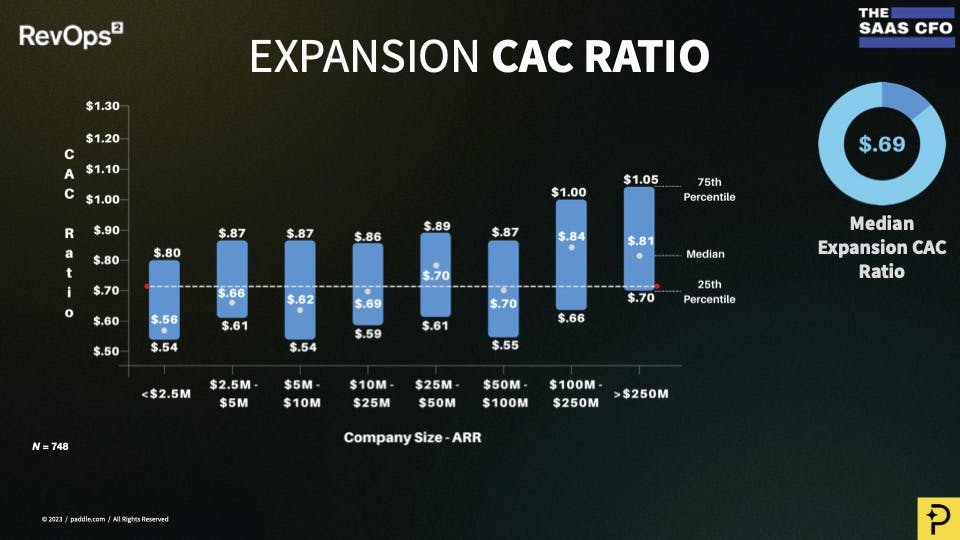
Metric: Expansion CAC Ratio measures how much sales and marketing expense (including customer success) is required to make an additional dollar of existing customer revenue. Driven by upsells, cross-sells and expansion, it provides an in-depth view into ‘the cost of ARR’ and enables companies to effectively determine customer growth investments. What’s more, it’s 2-3x more cost-effective to grow $1 of ARR from existing customers than gaining $1 from new customers (new CAC ratio can hit $2-3).
Benchmark: $0.69 of sales and marketing investment to generate $1 of incremental expansion ARR.
Top tips:
- Speak to sales and marketing leaders about where they’re spending their time to work out existing spend vs new customer spend (i.e. Look at account managers for existing business vs new business reps).
- Consider splitting off features that 15% of your most engaged users use into a new plan in order to grow 30-50% faster.
- Implement add-ons like faster support and single sign-on (SSO) to grow LTV 18-54%.
2# Net Dollar Retention
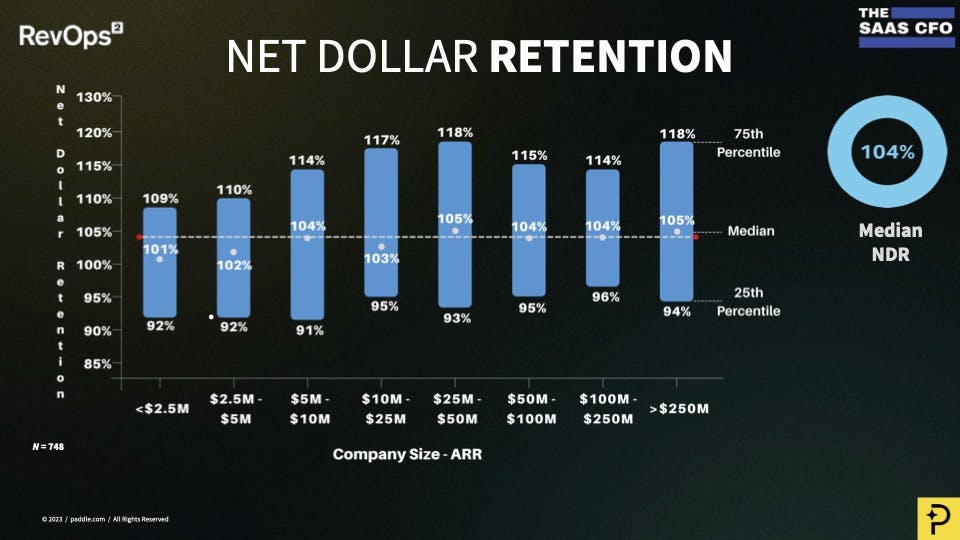
Metric: It’s the same Net Dollar Retention (NDR), but this time focused solely on the existing customer base (no new customer revenue). Expansion NDR not only shows you the efficiency of customer retention and the success of your down-sells, up-sells, cross-sells and expansion plans, but also has a real impact on enterprise value.
For example, in the first half of 2022, companies with 40% growth and >110% NDR were achieving 3-5x higher exit multiples than companies with 40% growth and <110% NDR.
Benchmark: >120% NDR is best in class net revenue retention with median NDR around 105% in 2022.
Top tips:
- Tweak your prices and packaging regularly (at least once per quarter) to increase ARPU.
- Localize your product (i.e. language, currencies, format) and pricing (i.e. buyers in the Nordics are willing to spend 27% more than US customers for the same product) to grow 25% faster.
- Use cancellation flows to reduce cancellations by 10-25%.
#3: CAC Payback Period
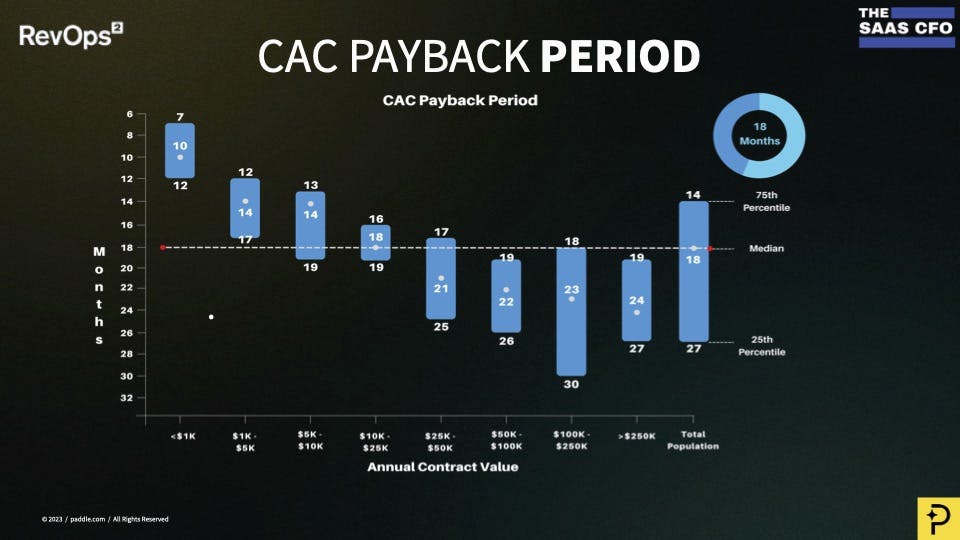
Metric: CAC Payback measures the number of months to pay back a new customer acquisition. Gross margin adjusted, CAC Payback will determine upfront customer cost (usually in terms of X amount of MRR) and how much cash flow is available to pay back that upfront CAC cost. But, as not all customers are the same, it’s crucial that you use average contract value (ACV) to segment the data into cohorts. For example, your CAC Payback will be different for SMBs on a one- month sales cycle versus enterprise customers on a 12-months cycle.
Benchmark: Depends on a range of variables, but if you're a $1K product, your CAC Payback should be 6-10 months, while a $100K+ product is more likely to have a 18-24 month payback period.
Top tips:
- Use new customer ACV instead of existing customer ARPA (average revenue per account) to work out CAC Payback as it’s the most recent (and therefore relevant) data.
- Start with overall CAC payback and then segment it down by different periods, sales cycles, products and geographies etc to get more accurate results.
- Accept long payback periods (i.e. up to 36 months) for large ACV accounts if retention is high.
#4: CLTV:CAC Ratio
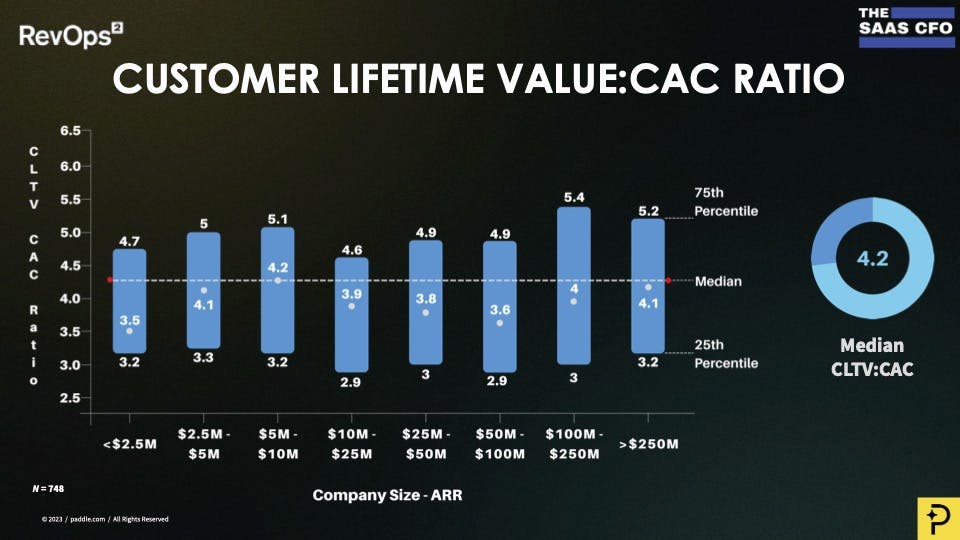
Metric: CLTV:CAC Ratio measures how much revenue a customer will deliver over its life
divided by the cost to acquire a customer. It’s a key capital efficiency measurement for investors and factors in gross margin, churn and customer acquisition costs. However, it’s relevance is determined by the size of your company and the customers you're going after: too small (i.e. 30K MRR) and CLTV:CAC is too volatile; too big (i.e. landing a $1 million customer) and CLTV:CAC is all over the place.
Benchmark: The median CLTV:CAC for companies over $5 million in 2022 was around $4.2, so the new rule of thumb is 4:1 (not 3:1 as in previous years).
Top tips:
- Revisit and segment your Ideal Customer Profile (ICP) to improve the accounts coming in at the top of the funnel.
- Audit your messaging to ensure you’re delivering a consistent value story that speaks to the person who's buying.
- Consider CLTV:CAC ratio based upon the channel of acquisition.
Rule of 40
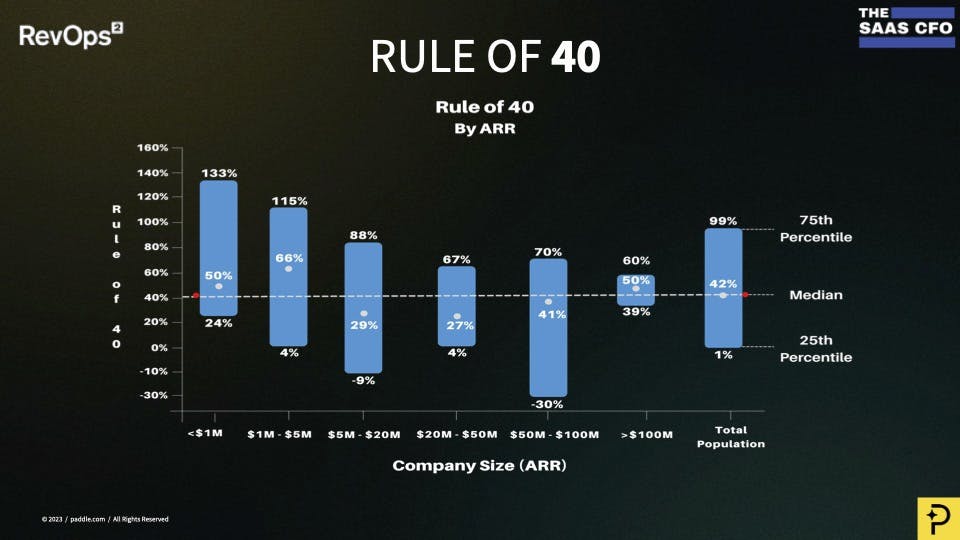
Metric: The Rule of 40 is back. Combining your year-over-year growth rate and adding in a profitability measurement, the Rule of 40 effectively measures your growth efficiency, gives companies an understanding of the ROI in their business and serves as a lighthouse for investors (especially helpful in uncertain conditions). It varies for company size, but hitting the rule of 40 becomes harder as you pass $10 million ARR as it's more challenging to grow at that pace.
Benchmark: In the first half of 2022, the Rule of 40 median was 42%. However, with efficient growth cool again, the benchmark has increased by 3x from January 2022 to January 2023 (i.e. highly negative numbers at an early stage are now a red flag and some private equity companies are looking at rule of 50 and rule of 60 for the top 10% of companies).
Top tips:
- Make strategic choices to remove costs from your business, including saying no to things that you really, really want to do.
- Focus on ongoing monetisation of existing customers because, past $40-50 million ARR, that becomes the bedrock of your future success.
- Prioritize your team, customers & product (the essentials) over everything else.
Context is key
It's important to keep in mind that metrics and benchmarks have the most impact when viewed in context. This means not only comparing metrics alongside others to get the big picture, but also selecting the right metrics for your company's particular stage.
For the full picture, check out the webinar on-demand here.


