
Ryan Buckley, CEO of MightySignal, has been thinking a lot about pricing lately. Today, he asks us a fascinating question about pricing in the software space: Is all software going to $0?
To answer this question, we looked at over 2 million customers and their preferences around features and willingness to pay, and here’s what we found.
*****We will only be posting a few of these episodes on the blog, which means if you want to make sure you don't miss an episode of this series you must subscribe separately below****
Don't miss out on more insights. Subscribe to get on the ProfitWell Report's list now.
Similar to the price of computers and memory, software prices have declined substantially since the 1980s and especially since the 90s and early 2000s when the cloud started to go mainstream. Costs have come down, buyer sophistication has increased, and information has become more symmetrical between buyers and sellers.
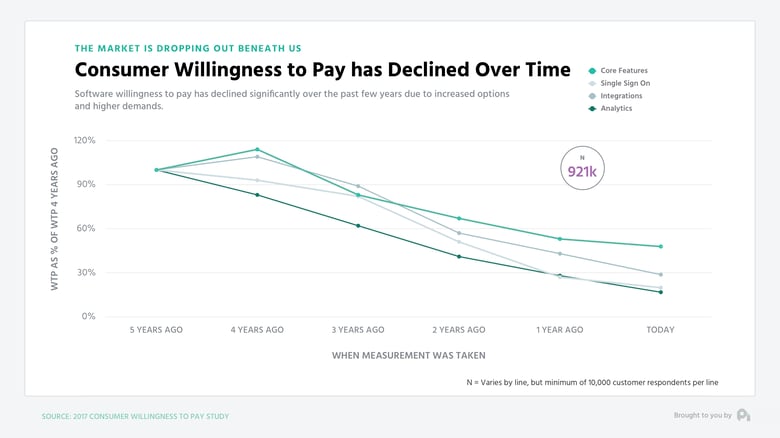
Where’s the floor though? After all, understanding the value cycles when it comes to features and functionality is crucial to ensuring you can defend your price.
Well, software value is certainly declining.
Click to enlarge
When looking at just over 900,000 customer data points, you’ll notice that products and features have lost 70% of their value over the past five years, meaning that Salesforce integration that you used to sell for $100 per month is now only worth $30 and in a lot of individual cases is probably worth just throwing into the core product.
The loss of value is shocking, but should feel pretty intuitive. After all, the cycles of production and shipping features has increased substantially.
You used to be able to give someone a database with a simple user interface and people thought you were a god. Now if the product doesn’t have good design and great support, it doesn’t matter what your core functionality is because it’s not going to pass as acceptable.
While the value will likely not go truly to zero, the pragmatic question becomes how quickly do products move from a place of value to a place of not being so valuable.
To answer this part, we need to introduce you to a model we’ve been talking about for a bit, but is probably something you haven’t seen before.
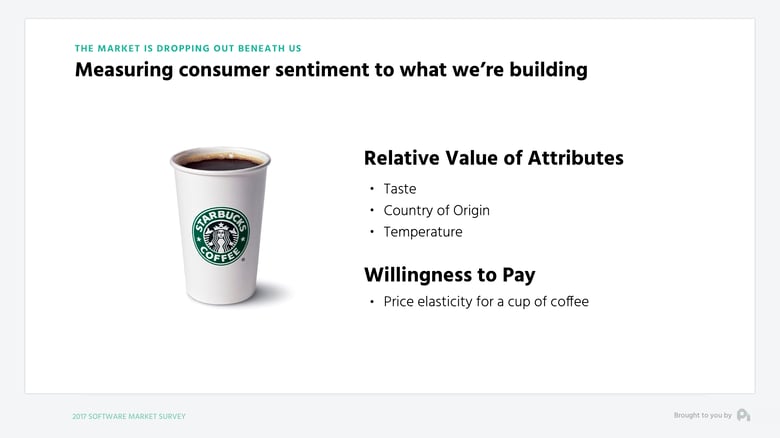
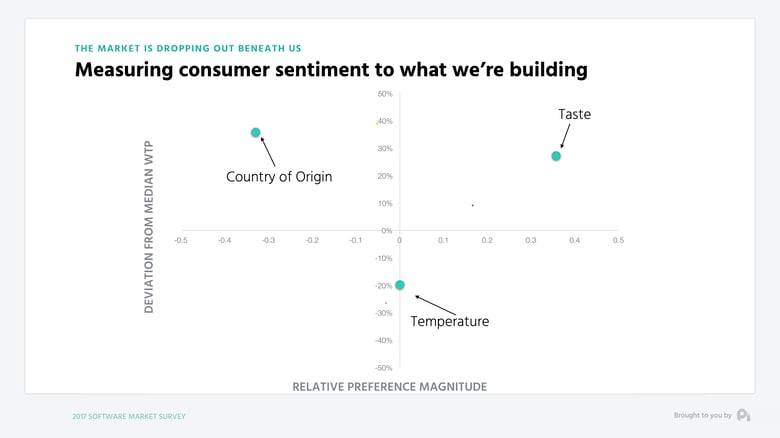
When you’re speaking about value of any product, anything from a cup of coffee to a piece of software, there are two axes of value - the relative value of the features or attributes of that product and then the actual willingness to pay for that product.
Click to enlarge
Click to enlarge
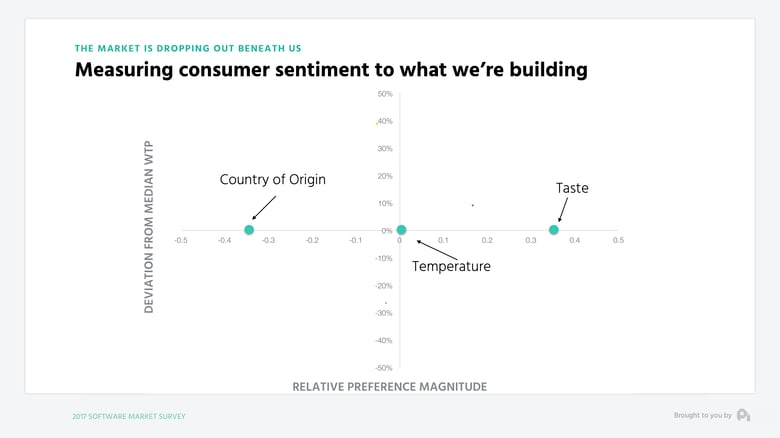
So if we look at a cup of coffee and we survey a large group using some clean statistical methodologies, we likely will find out that something like taste is the most important feature to that group and things like country of origin aren’t important in the aggregate.
Click to enlarge
When we layer on the willingness to pay data, we may find that those individuals that care about taste are willing to pay more, those who care about temperature less, and those who care about country of origin, there’s not a lot of them, but they are willing to pay more.
Click to enlarge
Now if we have a feature where the value relative to other features is high and the willingness to pay of the group that cares about that feature is high, then we have a differentiable feature.
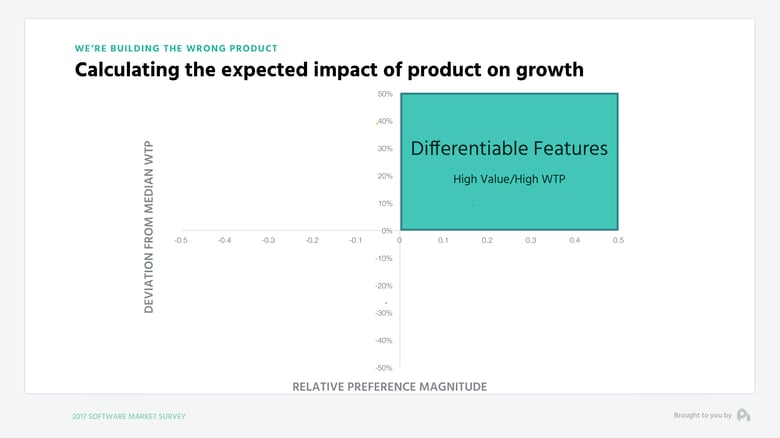
Click to enlarge
If we find a feature that is low value from a feature perspective, but has high willingness to pay, then we have an add-on.
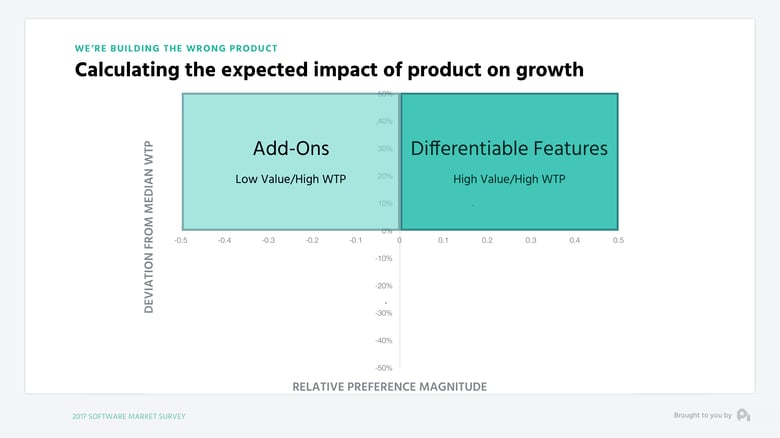
Click to enlarge
Something that is high value, but low willingness to pay will be a core feature.
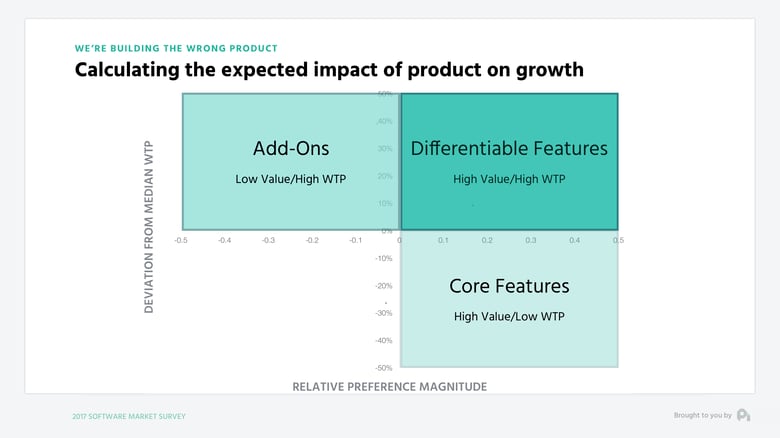
Click to enlarge
And finally, something low value and low willingness to pay will be trash.
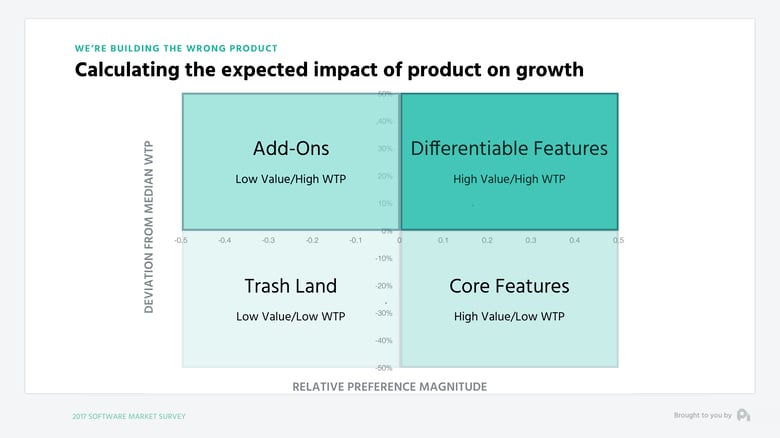
Click to enlarge
I’m introducing this model, because we’ve been able to study millions of different customers in terms of preferences and further study how features flow from one quadrant to another.
Ten years ago the flow of features looked like this - moving from add-on to differentiable and a bit of core, as well as from differentiable to core.
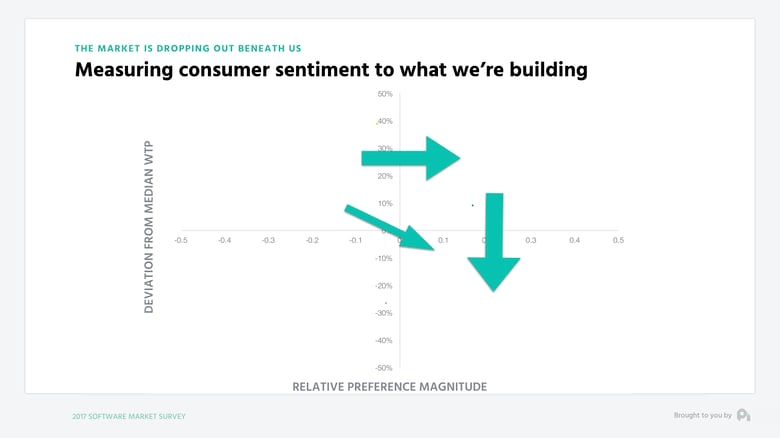
Click to enlarge
The average time a feature took to move from one quadrant to another was at a pace of 8 to 10 years. Today when measuring that velocity, this is what the movement looks like:
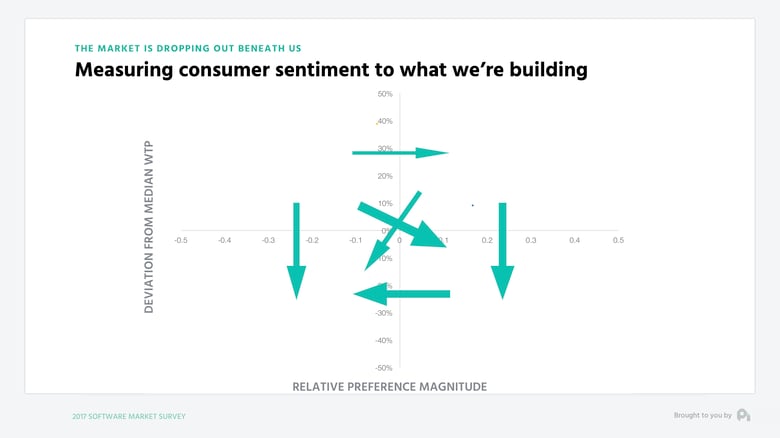
Click to enlarge
Features are moving quicker and quicker toward not just core, but also not being valuable into the trash quadrant. The average movement time from one quadrant to the next is now as low as 2 years.
To be clear, this isn’t to say that the features you’re building aren’t valuable at all. However, given everything that’s happening in the market, the speed through which features are losing their premium value is extremely troubling given our approach to building product, which is typically devoid of much data or customer research as we’ve seen in previous data studies.
Ultimately, the speed of the market is out of our control with so many companies are out there creating value.
The secret now becomes owning your position in the market and working to find those pockets of value that move slowly between the quadrants, or at the very least getting to a point where you’re measuring the pulse of your customers to understand exactly where you need to optimize your product for customer value, which trickles into retention and growth.
Well, that's all for now. If you have a question, ship me an email or video to neel@profitwell.com and if you got value here or on any other week of the report, we appreciate any and all shares on Twitter and LinkedIn. That’s how we measure if we should keeping doing this or not. We’ll see you next week.
By Neel Desai
Product Lead, ProfitWell