The health of your SaaS business is entirely in the data, and a lot of SaaS professionals tend to think that the more data they’re actively tracking, the better. But you can get a more representative picture of your progress by reducing the number of metrics you observe. The trick is identifying a smaller set of metrics that really tell the story of your business and making them your key performance indicators, or KPIs.
The good news is that the most important subscription KPIs are constant across SaaS businesses, whether you’re selling a timekeeping software or an accounting tool. Read on to find out what the top six subscription KPIs are, why you should be tracking them, and how.
Why subscription companies need to track KPIs
In SaaS, there are a huge number of metrics that can compete for your attention. It isn’t feasible to track every metric out there when forming a picture of your company’s performance.
Instead, you must focus on a reasonable number of KPIs. These are essential, widely used metrics to measure the overall health of your company. Meticulously tracking KPIs offers a number of important benefits for subscription companies.
Evaluate current performance
KPIs allow you to measure your business’s growth or decline over time. Comparing KPI data against benchmarks highlights whether your company’s performance is improving or not in that area.
For example, let’s say you’re measuring how much money you’re spending on acquiring each one of your new customers. If your customer acquisition cost (CAC) is one of your KPIs, and you also know that your benchmark is a <20% spend of total customer lifetime value (LTV) on acquisition, then evaluating your performance becomes a simple matter of comparison.
Predict future performance
A business is only as successful as the cash flow it’s likely to generate in the future, and this is where KPIs really come in handy. By tracking KPIsand measuring your actual performance against expected performance, you’ll find that identifying downturns in performance, and their root causes, becomes easier.
For example, if you find at the end of a year cycle that your MRR has been generally trending upward and your churn trending downward, you can predict that growth will be even greater next year. If you notice that churn or CAC has started to increase steadily over a period of months, then you can plan for how to avoid a much more negative forecast of your future growth.
Forecast demand
KPIs are also useful for establishing internal benchmarks for progress. These make it much easier to accurately forecast demand over the coming months and years. The SaaS valuation of your business, and your stakeholders’ peace of mind, will depend on your ability to use your data to forecast accurately. Choosing the right KPIs makes this possible.
If, for instance, you’ve noticed exponential growth in your bookings over the last several months, that may be an indicator that you’re at the start of a demand boom for your product. That’ll be music to your investors’ ears.
The six most important KPIs for subscription business
The KPIs that are useful for a SaaS company differ from those of a regular software company. With subscriptions instead of user licenses, SaaS companies must keep tabs on churn, MRR, bookings, and more to understand the health of their businesses.
To help you understand your SaaS company’s performance, let’s look at six essential subscription KPIs. We’ll cover why they’re important, how to calculate them, and where the industry benchmarks lie.
MRR Churn
Churn strikes fear into the heart of every SaaS professional. The only way to defeat it is to face it by putting MRR churn at the top of your KPI list.
MRR churn is the loss of revenue that comes about when customers leave your company. Churn can happen for a number of reasons: because customers haven’t gotten what they need from your product, feel like they have gotten all they need, have forgotten about your product, and more. Tracking your MRR churn will allow you to easily spot unexpected increases in churn and keep it at a level low enough that it’s not jeopardizing your business.
Calculating churn is straightforward.To do so, first calculate the total MRR lost from cancellations and delinquent churn.
Total MRR churn = MRR cancellations + delinquent churn
Once you’ve calculated your MRR churn amount, use it to calculate your monthly churn rate, like so:
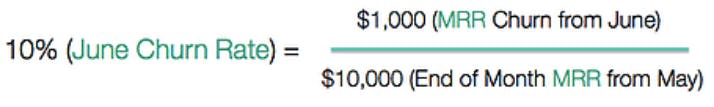
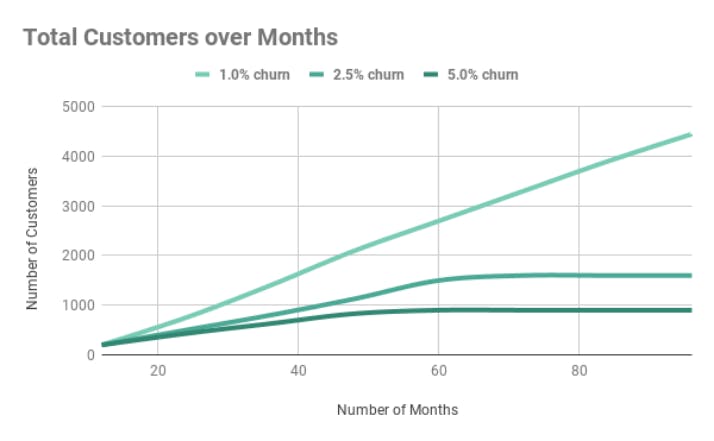
Aim to keep this churn rate at 1% or lower. Any higher churn rate will eventually compound too fast for your growth to compensate.
Churn can rapidly be fatal for young companies. It should be one of the most keenly observed of all your KPIs.
SaaS bookings
The bookings metric is the total revenue promised to your business through subscription contracts. It’s important to track because it provides a means of pulling together the various revenue channels your business has and, ultimately, providing the clearest possible means of calculating your actual growth. Audit troubles and the miscalculation of your growth await those who neglect to measure their bookings.
To calculate bookings, add together total promised revenue from new contracts, renewals, upgrades, and add-ons in a given period. Monthly is the best period to track, allowing you to catch any downturns before they get ugly. Subtract the downgrades and churned MRR from this total and you have your bookings total for that period.
Monthly bookings = (New Contract Revenue + Renewals + Upgrades + Add-ons) - Downgrades + MRR churn)
You don’t need to include these items when calculating your bookings:
- Set-up fees
- Credit adjustments
- One-time charges
- Discounts
One thing you should take care to measure is your proportion of new bookings (from new customers) to upgrade bookings (from existing customers). Upgrade bookings are considerably less expensive than new bookings, so you should generally seek to split your sales team’s attention with a preference toward upselling existing customers.
Customer acquisition cost (CAC)
CAC is the total cost of sales and marketing efforts needed to acquire each of your customers.
Even with the low cost of digital advertising, CAC remains a considerable expense. It involves the entire cost of sales and marketing over a given period, as well as sales team salaries incurred over the same time.
The large expense of acquiring new customers can be damaging to SaaS companies, especially if acquisition is used as a means to undermine churn. You’ll quickly find that the combination of a high CAC and a high churn rate overpowers even the healthiest MRR rate.
Because acquisition is so expensive, it’s critical to track CAC to save you from any unwelcome finance surprises. Calculate your CAC with the following formula:
- CAC = (total cost of sales and marketing) / (# of customers acquired)
CAC is especially high for early businesses. Acquiring a customer can cost between 150-200% of their first year’s actual contract value (ACV). However, that high CAC can be compensated with upsell opportunities within each contract. This strategy is known as the CAC Payback Model, where the total value of a customer’s LTV offsets the costs of their first year.
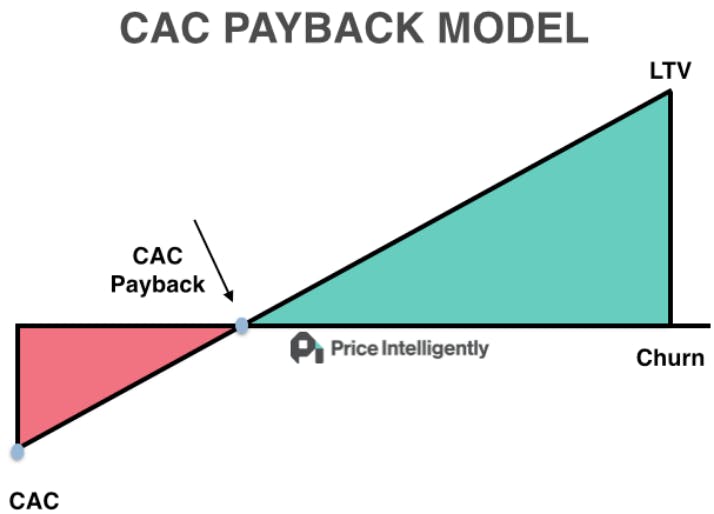
Once a SaaS company is established and healthy, CAC is often about 20% to 30% of their customer lifetime value (LTV).
Average revenue per user (ARPU)
A fourth vital KPI for any SaaS company to measure is average revenue per user, or ARPU. It’s a self-explanatory metric: the average revenue you’re getting per individual user, across the total number of different subscription plans being offered across your customer base.
Tracking your average revenue per user highlights how much value your customer base is providing to your company as a whole, as well as value by user type. For instance, from measuring your ARPU, you may find that one of the industries your company serves (let’s say the construction industry) contributes far more per month than another (let’s say the legal sector).
To calculate ARPU, divide the MRR from your active customers by your total number of customers.
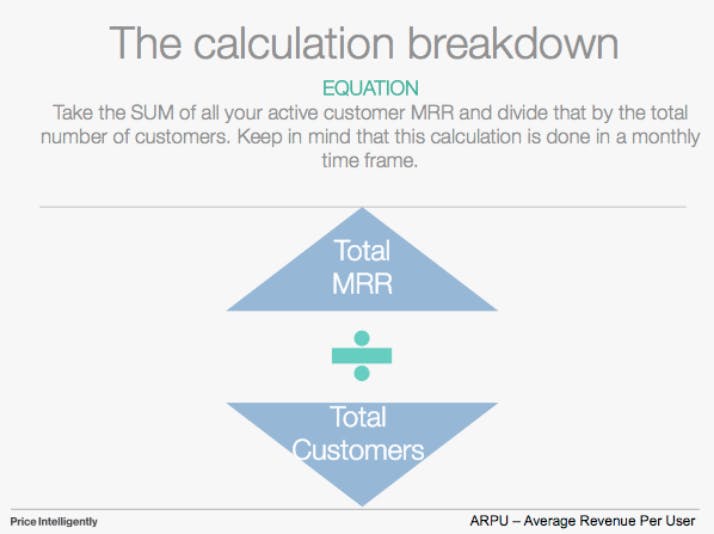
There is no clear standard for ARPU; it varies depending on your company’s product and pricing model. In general, subscription companies tend to have higher ARPUs than other business models, at around $0.04 per month.
Tracking ARPU allows you to be flexible in planning for both the long term and the short term by allowing you to identify trends in customer behavior and reinforce your understanding of your different customer personas.
MRR/ARR
Monthly returning revenue (MRR) and annual returning revenue (ARR) are both entirely central to a SaaS company’s operations. MRR is the normalized monthly revenue from all of the recurring items in a subscription. ARR goes by the same principle but is instead totaled up over a year from all recurring items in a subscription.
Both your MRR and your ARR help you understand whether your company’s performance is improving or declining. They can also help you predict future performance by highlighting trends, which can be extrapolated.
Use the following formulas to calculate MRR and ARR:
- MRR = ARPU x Total number of customers (across the Month)
- ARR = ARPU (annual rate) x Total number of customers (across the year)
To maintain a healthy subscription business, your MRR must outpace your churn and keep roughly equal with your bookings, as well as cover any further monthly expenses; if MRR falls behind these metrics, your business will cease growing. The same benchmarks, applied annually, will suffice to measure the health of your ARR.
Customer lifetime value (LTV)
LTV is the net profit you're likely to receive from an individual customer over the life of their account with your product.
This metric is critical to track, allowing you to evaluate profitability by checking whether LTV is higher than CAC. After all, a successful business model requires that your customer spends more than the cost of acquiring them.
The formula for calculating LTV is fairly simple:
- Customer Lifetime Value = (Annual revenue per customer x Customer relationship in years) – Customer acquisition cost
What complicates the picture is that in order for LTV statistics to be representative and usable, you need a significant enough customer base. A large SaaS company will see low variation in LTV, whereas for a small company, even relatively small changes to the customer base can produce results like this:
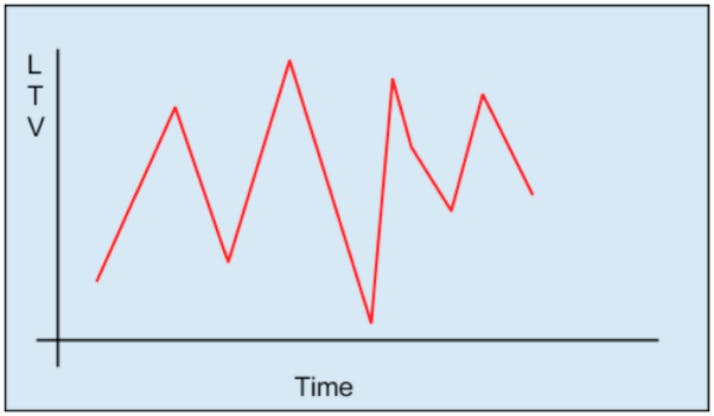
Unfortunately, the only means of acquiring more representative data as a small company is through patient collection over time. As your volume of data points increases, variation in LTV will begin to lower, and your data will become more representative.
In general, a health LTV:CAC ratio in SaaS is 3:1 or higher. At 4:1, your business model is working excellently. Any higher than that and it might be a sign that you could, in fact, be growing even faster with the right marketing push.
Measure for growth
These six subscription KPIs are critical to the success of your business. Understanding how to track and read them, with the help of this guide, will allow you to identify and prevent potential issues, plan more reliably, and grow more comfortably and consistently.
Save time keeping track of these KPIs by using an automated data solution. Programs such as ProfitWell Metrics help reduce the margin for error and tighten up your reporting, serving you as a practical subscription reporting platform for CEOs and offering everything in one place. It's giving you accurate, real-time subscription reporting and analytics and revealing where your growth comes from.